15x Faster Reporting with an AWS Data Lake Implementation
Our client needed a centralized, cloud-based repository to track and discuss brand financial performance worldwide. Executives, Brand Owners and Sales Directors wanted to make informed decisions and have analytics at the tip of their fingers. Our team had to consolidate various data sources into a single data warehouse and deploy dashboards that answer business critical-questions.
source of truth for all data
faster reporting
faster data processing
Business Case Story
Within a huge multinational automotive manufacturing corporation such as our client, a huge amount of effort is spent on collecting data at every stage of business operations. Unfortunately, aligning every department, contractor, dealer, and investor to provide uniform data is a very hard task. Not only that but then those parties need an output in the form of an analytics tool. This is where Zelusit came in and provided expertise and solutions.
The project has multiple business cases. The wholistic view aims to track the financial performance of the company through different lenses, therefore the client has a dedicated team that communicates with all the data providers and stakeholders. As mentioned, the collected data is diverse in its nature and usually requires a time-consuming thorough data analysis and data cleansing steps. The data is transformed in a machine-readable format and structure before it ends up in tables in the Redshift schema environment. Each table has a different source and sometimes composite keys need to be created. The end goal is to integrate all diverse data sources into a full functioning data warehouse.
Solution Story: AWS Data Lake Implementation
Zelusit created a full self-sustainable business intelligence system where multiple level of users can interact, explore, and visualize vitally important data about their business. The cloud-based Tableau site offers everything from user upload and automatic data cleanse portal to algorithmic statistical insights and dynamic user interface. Quality and delivery of data is being monitored and the ETL pipeline incorporates data cleansing infused with business understanding.
The initial use case was related to consolidating more than 150 manually filled Excel files from locations and brands around the globe. Data needed to be scrubbed and uniformed, data quality frameworks have been established with accompanying dashboards that monitors the delivery and quality of the delivered .xlsx files.
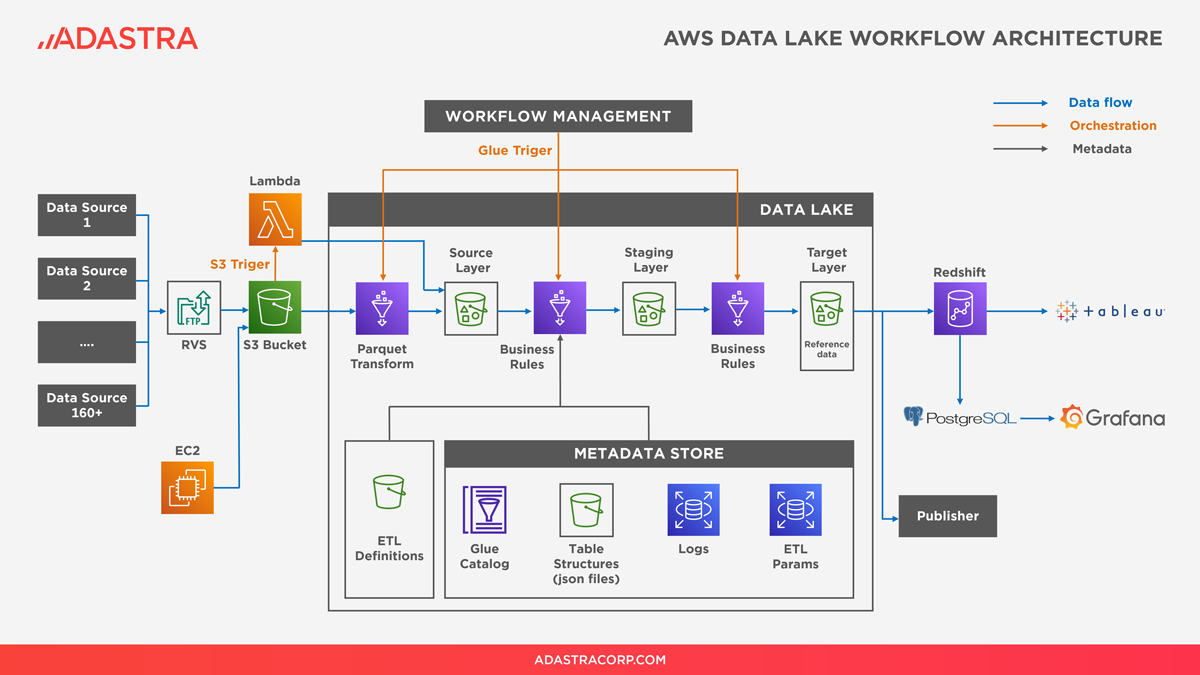
Illustration: AWS Data Lake Workflow Architecture
Business users can use a specially designed file uploader portal to directly feed the data warehouse with the latest country brand file, which goes through automated data quality checks. The business intelligence solution provides interactive UX, enabling the users to slice the data across locations, time, and multiple dimensional hierarchies. Radius map analysis, drill down visuals, dynamic trend analysis and scoring systems are just some of the features implemented by Zelusit to guide users through the data collected.
Some of the latest implemented features include Income statement dashboards and close tracking of Return on Sales. The work of Zelusit was used to pitch the BI solution to the board members and additional funds were acquired to further the efforts to digitalize the decision-making processes.
Business Intelligence System Enablers
- Find who are the biggest dealers and investors.
- Get a holistic view of growth opportunities based on specific dashboards.
- Present financial results quickly and directly through the dashboards.
- Identify most profitable areas of the business.
- Compare region and country aggregated financial results.
- See the impact of discounts on the volume of sales.
- Find the most profitable business models.
- Perform analysis down to the transaction of a vehicle.
Benefits Story
Our client experiences huge benefits by using Zelusit’s BI system in Tableau. The whole process saves a huge amount of man hours in reporting, makes the decision process easy and provides a self-serving business intelligence capability. The state of art data infrastructure allows almost instant query time and leaves no question unanswered. The process is continuously being improved by our BI consultants, and the data and robustness of the cloud-based server site is becoming a complete and full BI application for ensuring corporate financial success.
- Huge number of hours saved from creating decentralized reports by different departments for each business cycle.
- Instant and easy decision making – users can make decisions quickly based on latest market data.
- State of art Business Intelligence developments – best practices and newest Tableau techniques.
- Easy statistical analysis – correlation analysis, outlier detection, trend analysis and breakdown, proximity analysis, classification algorithms.
- 1 source of truth for all data – from dealer-level data to company return on sales analytics.
- 15x faster reporting
- 7x faster data processing