25% Shipping Cost Optimization for Supply Chain
Our client wanted to enable intelligent retail by leveraging Microsoft Power BI to power the company’s cloud-native retail order management analytics.
decrease in delayed shipments
decrease in shipping cost
source of truth for all data
Business Case Story
A global provider of transformative supply chain solutions had more than 40 merchants using separate SQL databases (DBs) which had to be combined in a single Data Warehouse in order to enhance comprehensive customized reporting for Supply Chain Management. The solution was supposed to replace an existing platform that provided limited reporting capabilities related to operational KPIs. There was no ability to interact with the data
Our client wanted to replace these static dashboards with interactive ones that provide advanced user experience (UX), historical data for trends comparison, and actionable insights. The main objective was to provide the end customers with an advanced analytics and reporting solution that ensures data-driven and smart supply management decisions.
The Solution: Advanced Analytics in the Cloud
The solution consolidates all customer’s Azure databases in a single Azure Data Warehouse. Our team developed a process that mirrors the original data into Azure Synapse Analytics.
We created Azure Analysis Services Tabular Model to ensure optimal performance for all calculations and reporting. Below you can see an animated illustration of the solution.
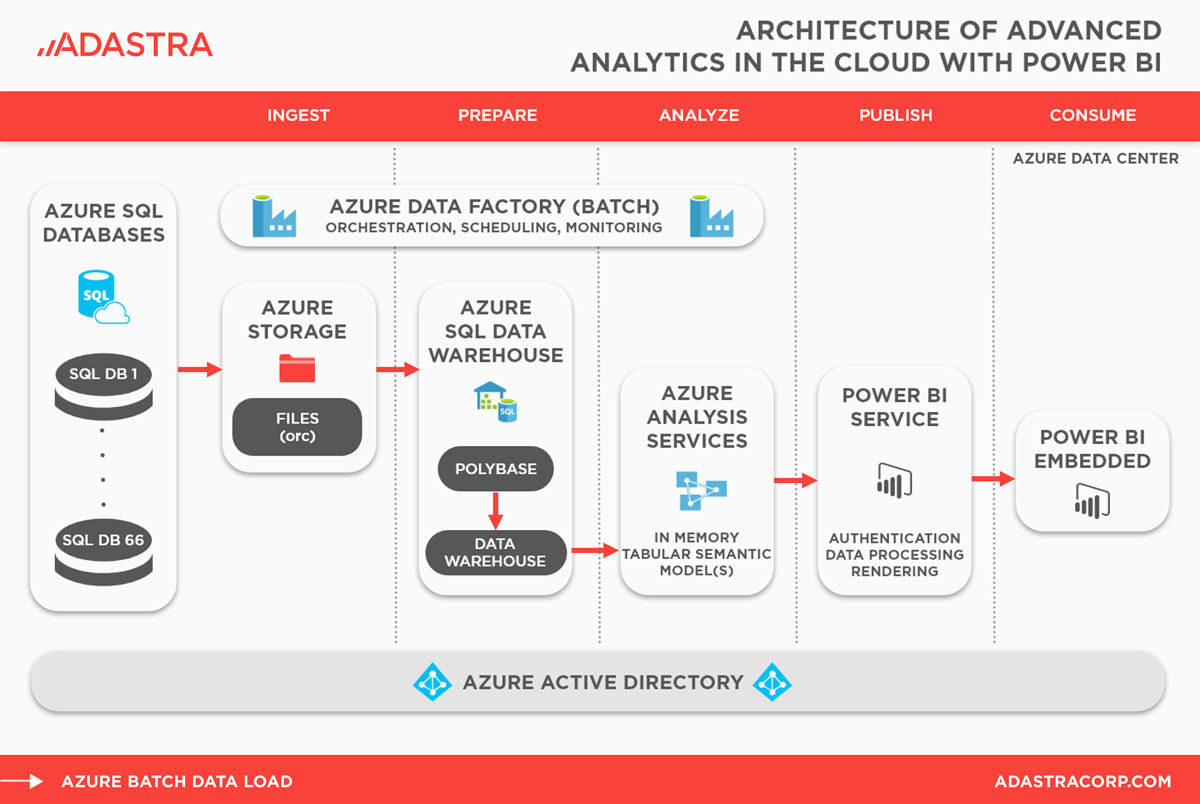
Figure 1: Advanced Analytics in the Cloud
All Power BI reports were embedded into the end users’ platforms. It enhanced seamless collaboration and faster strategic decision-making. The Power BI dashboards include dynamic visualizations capturing both historical and time-based comparisons. The platform supports advanced filtering of the data in a multi-dimensional manner.
Numerous of interactive dashboards were created to help analyze the data and see what has happened (descriptive analytics) as well as decipher and explore the ‘why’ behind it (exploratory analytics).:
- Time to completion – the time required to complete the order and all exceptions that can be further analyzed.
- Order amount advanced analytics – per shipping country, per channel, etc.
- BOPIS (buy online pick up in-store) vs. Ship to home
- Partial Shipments vs. Not Shipped Orders vs. Total Number of Orders
- Orphan shipments (by shipping center, share of orphan shipments, etc.)
- Rejected and rerouted shipments
- Shipping list cost vs. customer charged – order amount with negative shipping cost –
- Invoice amount advanced analytics – per country, per product, per channel, etc.
The new Power BI solution enabled all business users to interact with their data dynamically while being backed by world class supply chain and cloud computing technology. Users gained the ability to connect directly to source data, empowering in-house data science teams to perform deeper dive analysis of the most important supply chain KPIs.
Benefits Story
The cloud Data Warehouse solution enabled our client to equip its customers with operational KPIs tailored to advanced order distribution management. It enhanced out-of-the-box reporting that helps users identify order management bottlenecks, quantify process optimization and customer satisfaction opportunities, and analyze distribution channels for financial performance.
The customer pool of our client now relies on a complex analytics solution that gives them the opportunity to easily control the order management as well as catch exceptions and problematical orders almost in real-time.
The business intelligence feature unlocked rich order data for all the users. It lets them monitor top distributed order management KIPs with trending and time series views and interactive dashboards. It enabled them to master key supply chain processes and:
- Reduce the average time to completion.
- Decrease in shipping cost by increasing the share of BOPIS (buy online pick up in-store) shipments.
- Decrease in negative shipping cost (shipping cost vs. customer charged).
- Enhance invoice control and management.